Forecasting sales for the near future. Calculation of seasonal variation. Predictive model components
Most of the organizations that exist today were created for the sake of profit (organizations created "for the soul" are not taken into account). And each employee of the company in one way or another affects the size of this very profit. In order to get the result, it is necessary to set a "bar" for what each specialist should strive for.
In this way, the first thing why a forecast is needed is goal setting.
Some companies aim to increase revenues, others - to increase the number of transactions, and still others - to intercept customers from competitors. We will not describe in detail the methods of setting goals within the framework of this article. We offer only some techniques.
1. SMART ... The goal should be Specific, Measurable, Attractive, Realistic, Time framed.
2. The VODKA principle (a kind of SMART in Russian). The goal should be Inspirational, Time-limited, Daring but achievable, Specific, Measurable.
3. Criteria of CHIRKOR ... The goal should be Clear, Measurable, Realistic, Specific, Defined in time and space, formulated in terms of the Result, in the language of the performer.
Second, why do we need a forecast - to calculate the required human resource to achieve the goal.
Any sales department is first of all people. People who earn bread and butter for themselves, and related departments, and the owners of the company. How many people are needed to fulfill the sales plan? We sit down and count, based on the number of clients, the period of contact with each of the clients, the time for reactive activities, etc. The main thing is to remember that without a staffed sales department, the chances of realizing your plans are reduced.
Example 1
Calculation of the number of the sales department.
Let's say a company cooperates with 500 clients, which are divided into groups (A, B, C). Each group has a standard for the frequency of contacts with clients:
Group A - 1 visit in 2 weeks + 1 call in 2 weeks. It takes 30 minutes for a visit + 30 minutes for a trip + 10 minutes for a telephone conversation.
Group B - 1 visit per month + 1 call per month. It takes 20 minutes for a visit + 20 minutes for moving + 10 minutes for a telephone conversation.
Group C - 1 call per month, 10 minutes for conversation.
Let's say the base is divided as follows.
Group A clients - 50 people.
Clients of group B - 150 people.
Clients of group C - 300 people.
Thus, for clients of group A we spend: 50 clients x (2 visits per month x 60 min + 2 calls per month x 10 min) \u003d 7000 min (117 working hours).
For clients of group B we spend: 150 clients x (1 visit per month x 40 min + 1 call per month x 10 min) \u003d 7500 min (125 working hours).
For clients of group C we spend: 300 clients x 1 call per month x 10 minutes \u003d 3000 minutes (50 working hours).
Thus, it takes to communicate with clients per month: 117 hours (column A) +125 hours (column B) + 50 hours (column C) \u003d 292 hours.
Let's say, after deducting the time for entering into the database, extract of documents, planning meetings, etc. the specialist has 5 working hours per day for direct work with clients (5 hours per day x 21 working days \u003d 105 active hours per month).
It turns out that this company needs:
292/105 \u003d 2.8 (~ 3 specialists to work with 500 clients).
Third, why do you need a sales forecast, - warehouse management ... Without a sales forecast, we will either be in a situation of a shortage of goods, or in a situation of excess inventory. In both the first and second cases, we are losing money.
Example 2
The company sells fans. Due to the prevailing heat, the demand in one of the seasons was higher than ever. Customers called daily and the warehouses were already empty. As a result, lost profits and a dissatisfied client.
Example 3
The company filled up the warehouse with snow shovels (in anticipation of a repeat of Javier). The winter turned out to be little snow, and the goods remained in the warehouse until the next winter. As a result - loss of profit, losses due to the cost of renting a warehouse, etc.
Of course, someone may object, saying that in the first and second cases the weather conditions were to blame. I agree. But at the same time, I would like to note that if a company sells goods that depend on the temperature outside the window, then the weather forecast should be included in the calculation of the sales forecast.
The fourth factor- it's mobility ... In the case of working in several markets, the sales forecast allows you to relocate efforts in advance to the required market, thereby reducing the risks and costs of a seasonal decline or increase in sales.
Example 4
The company is engaged in the sale of crop protection products, i.e. the product has a pronounced seasonality. During the season, the company focuses on the main product, in the off-season it sells equipment that is needed all year round.
An important advantage of having a sales forecast is the possibility of prompt intervention in the process. This means that in the event of a drop in the indicators of a particular specialist or for a particular SKU, the management of the department / company as quickly as possible can take measures to correct the actions of the specialist or in relation to the SKU.
Example 5
According to the forecast, a specialist should sell 1000 units of goods per month, but in fact sold 100. Only a quick analysis of the reasons and taking measures can “save” the next months. And in the absence of a forecast, the management could catch this dynamics only at the end of the reporting period (for example, a year), and even then it is unlikely if there is no sales plan.
Now let's move on to answering the question: "Who needs a sales forecast?"
Let's divide it into two parts.
- Which companies need a sales forecast?
- Who in the company needs a sales forecast?
1. All companies involved in active sales, of course, a sales forecast is needed (for which - see above). At the same time, there are companies that are only engaged in shipping on request (passive sales). For them, the sales forecast does not make much sense, because sales are heavily dependent on the marketers and advertising specialists in the company. Although some of the elements of forecasting here also take place.
2. The forecast is needed by the company's management, in order to plan the company's activities and profits. As a result, it is possible to plan expenses for staff training, updating the material base of the office, bonuses, etc.
The forecast is needed by the sales specialists and the head of the sales department, since they are directly responsible for its implementation.
Marketing needs a forecast in order to plan their activities to maintain existing and bring new products to the market.
The forecast is needed for production and logistics to carry out and coordinate their activities.
And now it is logical to talk about who exactly should be engaged in forecasting sales in the company. Despite the fact that this process is complex, affecting all divisions of the company, the following categories of employees should be engaged in forecasting.
- Top management of the company
- Marketing divisions. Can provide information about trends and market trends
- Heads of sales areas. These are people who are most often between two fires: from above - “Wishlist” of the management, from below - the whining of specialists about the impossibility of fulfilling plans. Sales leaders see the situation from the inside and take responsibility for implementing the plan
- Sales department specialists. Who else but they know better than others the needs of customers
- Logistics and production divisions - in terms of production capacities and logistics capabilities (warehouse, transport, etc.)
It is important to remember that if a company has several divisions engaged in forecasting, then the forecasting methodology should be uniform.
If we briefly describe the forecasting procedure itself, then the following elements can be conventionally distinguished (we will do this using the example of a store of goods for children).
Macroeconomic forecast. This will include demographic estimates, birth rates, estimates of projected inflation, unemployment, customer spending and savings, government spending on supporting families, and other factors of relevance to the operation of the baby store.
Industry development forecast ... How many stores are there in the area? Do you plan to enter foreign chains? What consumer are the competitors targeting?
Company sales forecast. Actually, the volume of projected sales, based on external and internal factorsdescribed above.
Having in our hands an analyst on the macroeconomic situation, the forecast for the development of the industry, the capabilities of our company, we can use one method or another to make a forecast of sales for the future period.
But planning and forecasting does not end after writing the final document - the "sales forecast". It continues in the process of executing plans. This clearly demonstrates deming-Shewhart principle, or PDCA algorithm(Plan Do Check Act - planning action check adjustment).
(See Figure 1.)
As you can see from the figure, this is a repetitive cycle in which, moving through the steps, we take the following actions: if in the Check step it turns out that everything is fine and the goal has been achieved, then the Act step will be to go to the Plan step and set new goals and objectives. If, in the Check step, it is found that the circumstances have changed (the result is not achieved), then the Act step will be to make adjustments and go to the Plan step, in which we clarify the previously set goal and plan to achieve it.
Finally, it should be noted that forecasting alone is not a guarantee that the plan will be fulfilled. To achieve the goals, you need to make the efforts of all employees of your company.
2.1. TransparencyThe one who is responsible for the work of the sales department (especially cEOs and the owners), always wondering what's going on. While supervising (and actively helping) many salespeople, the sales manager is faced with a difficult choice: to whom to help? In other words, he must determine where his participation will be most beneficial. The sales forecast provides such an opportunity, since you can always see what the success or failure of a particular department, and, as a result, the company as a whole depends on at the moment.
2.2. The ability to influence and help on time, and not just criticize after the factLet's say it's February. If the company has implemented a sales forecast, then the head of the sales department understands what to expect from each of the sellers in February, and in March, and in April. If the sales cycle is two months, it’s useless to remember in March that this month was bad in terms of sales results, and criticize the seller retroactively. Discussing the March failure in April is counterproductive. It is better to approach the seller (by this word I mean a sales manager, not a seller in the market) in February and help him. To help in organizing his time, in joint search for clients, in the end, the way you need to help this particular seller. I want to note that for the seller this is both help and partial division of responsibility, since he announced an impending problem. An alarming message is contained in the mismatch of the forecast and previously planned results.
2.3. Player Coach ToolForecasting is essential if the sales leader intends to actively help their salespeople achieve success. He knows what is happening and where, he can plan his time (since he has both salespeople and his clients) and take responsibility for the results of his team. It's one thing to stand behind people (sellers) and explain to them what to do and how, and quite another to come closer. The latter relates to the field of mentoring (coaching): the leader in this case can play one of five roles - sponsor, mentor, evaluator and role model.
2.4 Time management toolNot all salespeople can manage their time wisely without the help of a more experienced employee, which should be the head of the sales department. A kind and hardworking salesperson will work the same with everyone, and the fact that the success of the month depends on a particular deal is unlikely to cause him to devote at least 30% of the time to this deal. Many sellers enthusiastically work with everyone (especially if the client lives in the same city as the seller, or everything can be solved by phone), and key clients meanwhile, they are spinning out of control.
If there is a sales forecast, the manager first helps his employees to realize this, then gradually they develop their own skill, and they themselves begin to manage their time in a different way. We are not talking about time management only in relation to the seller. Sometimes a forecast helps the whole company to prioritize correctly and see what really determines success.
2.5. Financial information for top managementA sales forecast is needed for those who are responsible for finances in terms of either generating revenue or managing the cost side. A company, as a rule, with a high degree of certainty can only say how much money it needs in a given period. For example, for February it is necessary to provide X money to pay rent, wages, commissions, travel, purchases, loan payments. But where, when and how much money will come, the information is less known and reliable. This is why the sales forecast plays such an important role. It is not only sellers who are waiting for it with interest, checking and rechecking.
2.6. Changing seller behaviorThe seller works one way or another to the extent of understanding his own tasks. For one, the client's statement that everything will be okay is enough, for the other - assurances that “we will pay this month,” even if it was said on the 30th. But if, with the implemented sales forecast system, you have to report in a strictly defined format when how much and where the income is expected - everything changes.
The number of outgoing calls, meetings, business trips, the quality of checks, behavior the seller. In turn, this means that the sales forecast is not something distant and unnecessary, which further puzzled the seller, but work. The most real, important, essential work that affects the final result.
2.7. Standard and common information spaceWithout unified system and agreements on which deals and how to account in terms of timing and likelihood of successful completion, different sellers will introduce a lot of subjectivity in their assessments and reports. Someone will become silent, someone will be cautious, someone - on the contrary, show unreasonable optimism, and the overall picture will be greatly distorted in relation to reality.
2.8. Forecast as an element of operational-tactical planningThe company's strategic plans are being prepared for many years to come. By "many" some understand 3-5 years, others - 10, still others (Yoko Matsushita) - 150. At the level of the year, the state has a budget, and the company has an annual financial plan, which also contains a document such as a sales volume plan (quota). On a shorter period of time - week, month, quarter - the main tool is the sales forecast. Operational planning based on a forecast, of course, concerns the entire company. Purchases, investments, or, conversely, cost reductions are made based on the sales forecast. This happens where the forecast has worked and you need to believe it (within the framework of the probability that suits the company). The framework is different everywhere, depending on the industry and the company itself. The key question is this: if I don't know exactly what will happen and when, do my competitors know, or is it uncertainty for everyone?
2.9. Separation of passive and active salesThe company must always understand which of its sales are active and which are passive: they need people with different knowledge and skills. Passive sales should not be expected to grow above the industry average. There are many differences, and the rule is simple: if you cannot say what you expect and when, it means that what is happening does not depend on you.
To date, science has advanced quite far in the development of forecasting technologies. Experts are well aware of the methods of neural network forecasting, fuzzy logic, etc. The corresponding software packages have been developed, but in practice, unfortunately, they are not always available to the average user, and at the same time, many of these problems can be successfully solved using the methods of operations research, in particular simulation modeling, game theory, regression and trend analysis, implementing these algorithms in the well-known and widespread software package MS Excel.
This article presents one of the possible algorithms for constructing a forecast of the volume of sales for products with a seasonal nature of sales. It should be noted right away that the list of such goods is much wider than it seems. The fact is that the concept of “season” in forecasting is applicable to any systematic fluctuations, for example, if we are talking about studying the turnover during the week, the term “season” means one day. In addition, the cycle of fluctuations can differ significantly (both up and down) from the value of one year. And if it is possible to identify the magnitude of the cycle of these fluctuations, then such a time series can be used for forecasting using additive and multiplicative models.
The additive forecasting model can be represented as a formula:
where: F - predicted value; T - trend; S - seasonal component; E - forecast error.
The use of multiplicative models is due to the fact that in some time series the value of the seasonal component is a certain fraction of the trend value. These models can be represented by the formula:
In practice, an additive model can be distinguished from a multiplicative model by the magnitude of the seasonal variation. The additive model has an almost constant seasonal variation, while in the multiplicative model it increases or decreases, graphically this is expressed in a change in the amplitude of the seasonal factor fluctuation, as shown in Figure 1.
Figure: 1. Additive and multiplicative forecasting models.
Algorithm for building a predictive model
To predict the volume of sales, which has a seasonal nature, the following algorithm for constructing a forecast model is proposed:
1. The trend is determined that best approximates the actual data. An essential point here is the proposal to use a polynomial trend, which makes it possible to reduce the forecast model error.
2. Subtracting the trend values \u200b\u200bfrom the actual sales volumes, define values \u200b\u200bof the seasonal component and adjusted so that their sum is equal to zero.
3.The errors of the model are calculated as the difference between the actual values \u200b\u200band the values \u200b\u200bof the model .
4. A forecasting model is built:
where:
F - predicted value;
T
- trend;
S
- seasonal component;
E -
model error.
5. Based on the model, the final forecast of the sales volume is built. For this, it is proposed to use methods of exponential smoothing, which allows taking into account possible future changes in economic trends, on the basis of which the trend model is built. The essence of this amendment lies in the fact that it eliminates the lack of adaptive models, namely, it allows you to quickly take into account emerging new economic trends.
F pr t \u003d a F f t-1 + (1-a) F m t
where:
F f t-
1 - the actual value of the volume of sales in the previous year;
F m t
- the value of the model;
a -
smoothing constant
Practical implementation this method revealed the following features:
- to make a forecast, you need to know exactly the size of the season. Research shows that many foods are seasonal in nature, with the size of the season varying from one week to ten years or more;
- the use of a polynomial trend instead of a linear one can significantly reduce the model error;
- if there is a sufficient amount of data, the method gives a good approximation and can be effectively used to predict the volume of sales in investment design.
Let us consider the application of the algorithm in the following example.
Initial data: sales volumes for two seasons. As the initial information for forecasting, we used information on the sales volumes of ice cream “Plombir” by one of the companies in Nizhny Novgorod. This statistics is characterized by the fact that the values \u200b\u200bof the sales volume have a pronounced seasonal character with an increasing trend. The initial information is presented in table. one.
Table 1.
Actual volumes of product sales
|
Sales volume (rub.) |
Sales volume (rub.) |
||||
|
september |
september |
||||
Task: make a forecast of product sales for next year by month.
Let us implement the algorithm for constructing a predictive model described above. It is recommended to solve this problem in MS Excel, which will significantly reduce the number of calculations and the time for building the model.
1. Determine the trendthat best approximates the actual data. For this, it is recommended to use a polynomial trend, which reduces the error of the forecast model).

Figure: 2. Comparative analysis polynomial and linear trend
The figure shows that the polynomial trend approximates the actual data much better than the linear one usually suggested in the literature. The determination coefficient of the polynomial trend (0.7435) is much higher than the linear one (4E-05). To calculate the trend, it is recommended to use the “Trendline” option of the PPP Excel.
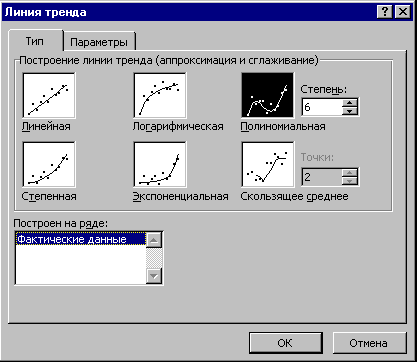
Figure: 3. Option "Trend lines"
The use of other types of trend (logarithmic, power, exponential, moving average) also does not give such an effective result. They unsatisfactorily approximate the actual values, the coefficients of their determination are negligible:
- logarithmic R 2 \u003d 0.0166;
- power R 2 \u003d 0.0197;
- exponential R 2 \u003d 8E-05.
2. Subtracting the trend values \u200b\u200bfrom the actual sales volumes , we determine the values \u200b\u200bof the seasonal componentusing the MS Excel application package (Fig. 4).

Figure: 4. Calculation of the values \u200b\u200bof the seasonal component in the PPP MS Excel.
Table 2.
Calculating the values \u200b\u200bof the seasonal component
|
Months |
Volume of sales |
Trend value |
Seasonal component |
Let's adjust the values \u200b\u200bof the seasonal component so that their sum is equal to zero.
Table 3.
Calculation of the average values \u200b\u200bof the seasonal component
|
Months |
Seasonal component |
||||
3. Calculate the model errors as the difference between the actual values \u200b\u200band the model values.
Table 4.
Calculation of errors
|
Month |
Volume of sales |
Model value |
Deviations |
Find the root mean square error of the model (E) by the formula:
E \u003d Σ О 2: Σ (T + S) 2
where:
T- trend value of sales volume;
S
- seasonal component;
ABOUT
- deviations of the model from the actual values
E \u003d 0.003739 or 0.37%
The magnitude of the error obtained allows us to say that the constructed model approximates well the actual data, i.e. it fully reflects the economic trends that determine the volume of sales, and is a prerequisite for making high quality forecasts.
Let's build a forecasting model:
The constructed model is shown graphically in Fig. 5.
5. Based on the model, we build the final forecast of the sales volume. To mitigate the impact of past trends on the reliability of the forecast model, it is proposed to combine trend analysis with exponential smoothing. This will make it possible to level the lack of adaptive models, i.e. take into account emerging new economic trends:
F pr t \u003d a F f t-1 + (1-a) F m t
where:
F pr t - the forecast value of the volume of sales;
F f t-1
- the actual value of the volume of sales in the previous year;
F m t
- the value of the model;
a
- smoothing constant.
It is recommended to determine the smoothing constant by the method expert assessmentsas the probability of maintaining the existing market situation, i.e. if the main characteristics change / fluctuate with the same speed / amplitude as before, then there are no prerequisites for a change in the market situation, and therefore a ® 1, if vice versa, then a ® 0.

Figure: 5. Sales forecast model
Thus, the forecast for January of the third season is determined as follows.
We determine the predicted value of the model:
F m t \u003d 1 924.92 + 162.44 \u003d 2087 ± 7.8 (rub.)
Actual sales volume in the previous year (F f t-1)amounted to 2 361 rubles. We accept a smoothing factor of 0.8. Let's get the forecast value of the sales volume:
F pr t \u003d 0.8 * 2 361 + (1-0.8) * 2087 \u003d 2306.2 (rub.)
In addition, to improve the reliability of the forecast, it is recommended to build all possible forecast scenarios and calculate confidence interval forecast.
Dmitriev Mikhail Nikolaevich, Head of the Department of Economics and Entrepreneurship of the Nizhny Novgorod University of Architecture and Civil Engineering (NNGASU), Doctor of Economics, Professor.
Address: 603000, N. Novgorod, st. Gorky, 142a, apt. 25.
Tel. 37-92-19 (home) 30-54-37 (work)
Koshechkin Sergey Alexandrovich, candidate of economic sciences, art. Lecturer at the Department of Economics and Entrepreneurship, Nizhny Novgorod University of Architecture and Civil Engineering (NNGASU).
Address: 603148, N. Novgorod, st. Chaadaeva, 48, apt. 39.
Tel. 46-79-20 (home) 30-53-49 (work)
Competent forecasting of sales volume is one of the main ingredients for the success of your business. When it comes to products, sales forecasting makes it possible to optimize stock in the warehouse.
It is essential that sales managers understand that forecasting sales volumes is one of their professional responsibilities... They often focus on the sales themselves.
The purpose of forecasting sales is effective planning of activities. And this task should be entrusted to the sales manager. After all, an enterprise accountant cannot predict the growth or decline in demand for products. Based on the forecasting results, sales volume planning is carried out, and, consequently, business planning. And in case of erroneous forecasts, the indicators will be inaccurate.
I.e main goal forecasting is the distribution of company resources to ensure the required sales volume. A company can forecast sales by forecasting the market as a whole and then calculating the share of its product, or by predicting the company's sales volume.
The simplest way to predict is to extrapolate - the spread of existing trends in the future. This forecasting method is suitable for short-term planning, but if a long-term forecast is required, the likelihood of changes in market conditions should be taken into account.
There are three main groups of sales forecasting methods:
Expert assessment methods based on assessing the current moment and development prospects. They are used in situations where it is not possible to obtain up-to-date information about a process or phenomenon;
methods of analysis and forecasting of time series - associated with the study of indicators independent of each other, consisting of two elements - forecasts of a deterministic and random component;
casual or causal forecasting methods - the search for factors that affect the behavior of the predicted indicator.
The use of certain methods depends on the goals of forecasting. - short-term (week, month, quarter) or long-term (1 year or more) forecast. Planning sales over the long term is more difficult because there are factors that can affect the expected results.
However, making accurate forecasts for the company is also quite capable of a task.
An accurate forecast is such a forecast, the deviation of which fluctuates within 10% of real indicators. In order to build an accurate forecast, you will need to do the following:
1. Record accurate sales figures for specific periods of time in the past period, for example, monthly sales for the year.
2. Calculate the seasonality factors for each time interval and plot the corresponding graph.
3. Calculate the price elasticity of demand. To do this, first of all, determine how the demand for your products changes when prices change.
4. Consider the growth of production or the opening of new outlets.
5. Calculate the coefficient of influence external factors (competition, economic situation in the country). This requires a sales history for a long period (at least 2 years). The sales forecast for the last year is calculated taking into account the coefficients of elasticity and seasonality and compared with real figures. The difference is an indicator of the influence of external factors.
6. Familiarize each sales person with the forecast.
Accurate forecasting of sales volumes makes it possible to reduce costs, optimally plan the activities of the company and efficiently allocate available resources.